Since 2025, China’s garment industry has faced external challenges: weakening domestic and foreign market demand, and global supply chain adjustments triggered by U.S. tariff hikes. Yet the industry has deepened transformation, promoted high-quality development, and maintained basic stability. Production stayed steady, domestic sales grew moderately, export declines narrowed, and investment rose rapidly. However, enterprise efficiency came under severe pressure due to intensified competition and rising costs.
Looking to the second half, the industry’s environment remains complex. Global trade risks, U.S. tariff uncertainties, and high tariff costs pressure exports. Domestic demand is insufficient, and operational pressures mount. To 应对 this, enterprises should accelerate digital, intelligent, and green transformation; expand diversified markets; strengthen supply chain resilience; and mitigate risks to drive high-quality development.
01 Economic Operation of the Garment Industry in H1 2025
01 Overall Stable Garment Production
H1 saw stable garment production, with output growing year-on-year, supported by domestic demand release and rising export volumes. Per National Bureau of Statistics data:
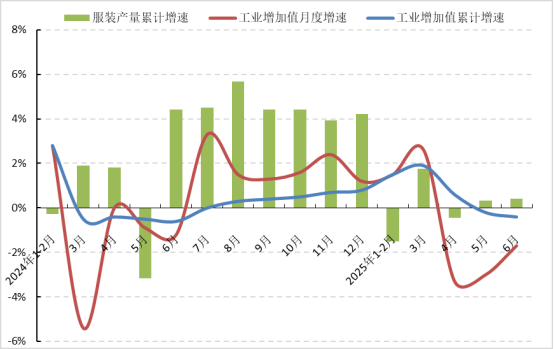
- Jan-Jun: Industrial added value of large-scale enterprises (LSEs) fell 0.4% YoY, a 0.2pp narrower decline than H1 2024.
- LSEs’ garment output rose 0.4% YoY, but growth slowed 4.02pp vs H1 2024.
Category Breakdown
Knitted garments led growth amid demand for sportswear and functional casual wear. Jan-Jun:
- Knitted output up 1.38% YoY, accounting for 69.25% of total output (+0.24pp vs H1 2024).
- Woven output down 1.72% YoY. Down garments bucked the trend (+4.28%), while suits (-8.61%) and shirts (-2.71%) declined.
Figure 1: Growth Rate of Garment Industry Production from Jan-Jun 2025
(Clothing output cumulative growth rate, Industrial added value monthly growth rate, Industrial added value cumulative growth rate)
Data source: National Bureau of Statistics
02 Moderate Growth in Domestic Sales
National consumption-boosting policies, holiday spending, and more promotions drove steady domestic clothing sales.
Key Data
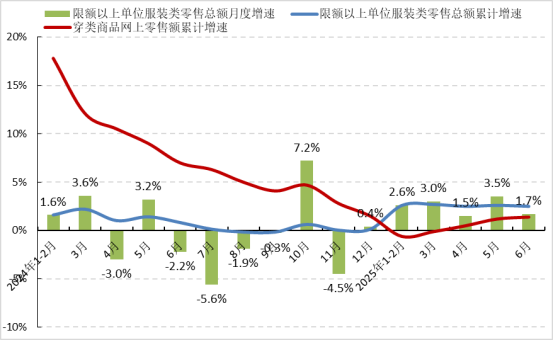
- Jan-Jun: Retail sales of clothing by large-scale retailers hit 534.13 billion yuan, up 2.5% YoY (+1.7pp vs H1 2024).
- Live-streaming e-commerce and early “618” promotions lifted online sales: Clothing online retail sales rose 1.4% YoY, 1.5pp higher than Jan-Mar.
Figure 2: Domestic Market Garment Sales from Jan-Jun 2025
(Monthly growth rate of retail sales of clothing by large-scale retailers, Cumulative growth rate of retail sales of clothing by large-scale retailers, Cumulative growth rate of online retail sales of clothing products)
Data source: National Bureau of Statistics
03 Fluctuating Narrowing of Export Declines
Exports fluctuated due to weak global demand and U.S. tariff policies but improved as tariffs were suspended.
Overall Performance
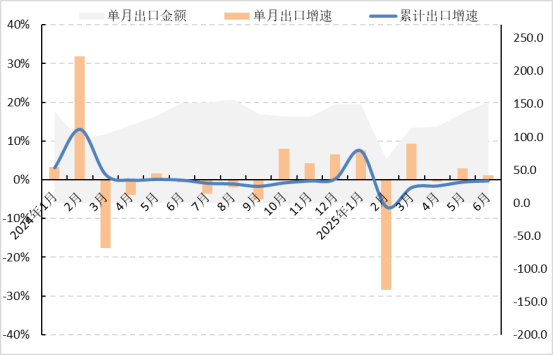
Jan-Jun: Total exports of clothing and accessories reached $73.46 billion, down 0.2% YoY (0.2pp lower than H1 2024). Monthly trends:
- Jan-Feb: Volatility due to Spring Festival.
- March: 9.9% YoY growth, driven by “rush exports” and low 2024 base.
- May-June: 3.0% and 1.1% YoY growth, as enterprises leveraged the tariff suspension window.
Volume-Price Dynamics
Exports showed “rising volume, falling prices”:
- Quantity: 17.17 billion pieces (+8.7% YoY).
- Average price: $3.5/piece (-7.9% YoY).
Category Trends
- Knitted garments: $32.19 billion (-1.0% YoY); quantity +8.1% YoY, price -8.3% YoY.
- Woven garments: $28.58 billion (+1.5% YoY); quantity +10.1% YoY, price -7.8% YoY.
Figure 3: Exports of China’s Clothing and Clothing Accessories from Jan-Jun 2025
(Monthly export value, Monthly export growth rate, Cumulative export growth rate)
Data source: China Customs
High-Value & Niche Category Performance
- Commuting/social wear: Casual suits (+17.1%), trousers (+6.2%), shirts (+0.7%) saw growth.
- Suits/T-shirts: Volume up but price down (-12.5% and -13.3% YoY).
- Bathrobes/down jackets: Volume down but price up (+23.5% and +14.5% YoY).
Key Export Markets
- U.S.: $15.34 billion (-3.6% YoY), with growth sliding 7.1pp vs H1 2024, pressured by trade uncertainty.
- EU: $13.76 billion (+11.3% YoY), up 13.6pp vs H1 2024, offsetting tariff impacts.
- Japan: $5.49 billion (+1.6% YoY), up 8.6pp vs H1 2024, stable overall.
- UK/South Korea: $2.49 billion (+15.9%) and $3.20 billion (+6.6%), with growth accelerating 10.1pp and 10.6pp vs H1 2024.
Emerging & Declining Markets
- ASEAN/”Belt and Road”: Exports fell 15.9% ($6.63 billion) and 10.6% ($19.45 billion), hit by tariff spillovers.
- Diversification gains: Exports to Latin America (+13.8%), Africa (+12.3%), Chile (+20.9%), and Canada (+11.6%) grew strongly.
Regional Export Performance
- Eastern China: $58.93 billion (+0.8% YoY), 80.2% of national total. Zhejiang (+7.4%), Jiangsu (+3.4%), Shandong (+10.7%) grew; Guangdong (-9.9%), Xinjiang (-10.6%) declined.
- Central/Western China: $14.53 billion (-3.9% YoY). Hubei (+19.1%), Guangxi (+16.7%), Jiangxi (+6.6%) rose; Sichuan dropped 37.9%.
04 Rapid Growth in Investment
Supported by national policies, enterprises boosted transformation investment, driving rapid fixed-asset growth. Jan-Jun:
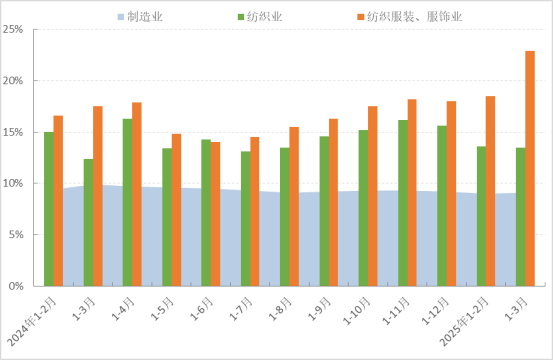
- Actual investment up 27.0% YoY (+13.0pp vs H1 2024).
- Outpaced manufacturing (+19.5pp) and textiles (+12.5pp).
Figure 4: Fixed-Asset Investment in the Garment Industry from Jan-Jun 2025
(Manufacturing industry, Textile industry, Textile, clothing, and apparel industry)
Data source: National Bureau of Statistics
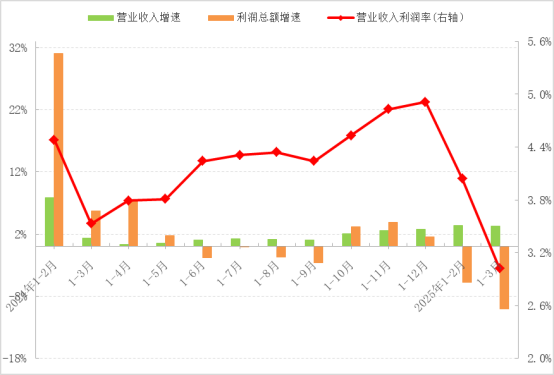
05 Severe Profit Pressure
Weak demand and rising costs squeezed profits. Jan-Jun data for LSEs (annual revenue ≥20 million yuan):
- 13,655 enterprises; revenue 564.88 billion yuan (-1.43% YoY).
- Profits 20.92 billion yuan (-12.92% YoY); profit margin 3.70% (-0.49pp YoY, +0.68pp vs Q1).
Operational Efficiency
- Loss ratio: 30.67% (+1.68pp vs H1 2024).
- “Three expenses” ratio: 10.01% (+0.03pp YoY).
- Cost per 100 yuan revenue: 85.60 yuan (+0.46 yuan YoY).
- Turnover rates: Finished products (9.74x/year, -3.51% YoY); accounts receivable (5.99x/year, -6.62% YoY); total assets (1.09x/year, -3.73% YoY).
Figure 5: Main Benefit Indicators of the Garment Industry from Jan-Jun 2025
(Operating income growth rate, Total profit growth rate, Operating income profit rate (right axis))
Data source: National Bureau of Statistics
02 Key Influencing Factors in H1 2025
01 Weak Domestic Demand Recovery
Macroeconomic stability and rising incomes supported consumption, but clothing demand lagged. H1 data:
- Per capita disposable income (+5.4% YoY) and consumption (+5.3% YoY) rose.
- Urban unemployment: 5.0% (Q2), down 0.3pp vs Q1.
Yet clothing consumption grew weakly:
- Per capita clothing spending: 843 yuan (+2.1% YoY), 6.0pp slower than H1 2024.
- Lagged education/entertainment (+9.7pp) and transport/communication (+6.3pp), limiting market expansion.
02 Weak Global Demand
Global trade tensions and geopolitics dented demand in major markets.
- U.S.: May personal income (+4.1% YoY) and spending (+4.5% YoY) slowed 0.8pp and 0.7pp vs April. June clothing retail sales (+2.71% YoY) lagged May’s 3.21%.
- EU: June euro zone retail sales (+0.3% YoY); HICP (+2.0% YoY), showing slow growth.
- Japan: May core CPI (+3.7% YoY to 111.4); textile/clothing retail (+6.0% YoY), but high prices constrained demand.
03 Intensified Global Competition
U.S. trade restrictions and improving supply chains in Vietnam/Bangladesh reshaped global trade.
- Competitor exports: Vietnam’s textiles (+10.0% YoY Jan-Jun); Bangladesh (+13.2%) and Cambodia (+21.9%) Jan-Apr.
- Market share shifts:
- U.S.: China -2.9pp; Vietnam +1.6pp, Bangladesh +1.3pp (Jan-May).
- Japan: China -2.1pp; Vietnam +1.2pp, Cambodia +0.6pp (Jan-May).
- EU: China +1.7pp; Bangladesh +1.2pp, India +0.2pp (Jan-May).
03 Industry Development Features in H1 2025
01 Expanding Private Domain Marketing
Private domain channels—enterprise WeChat, official accounts, live streams—drove e-commerce growth. Brands built communities to share previews, styling tips, and news. High-frequency interaction boosted user loyalty, retention, and repurchases.
02 Outdoor Sportswear as a Highlight
Younger, health-focused consumers fueled outdoor wear demand.
- Li-Ning launched women’s fitness lines for yoga/Pilates.
- 361° opened 49 immersive stores, lifting single-store efficiency.
- Tech upgrades: Anta invested in sport tech; Camel/PELLIOT/KAILAS improved fabric performance (waterproof, breathable).
03 AI Empowering the Industry
AI transformed design, production, and marketing.
- Production: Tianmen (Hubei) used AI + smart hanging to cut delivery from 3 days to 4 hours.
- Marketing: AI generated visuals and targeted ads, boosting efficiency.
04 H2 2025 Outlook
H1 stability may face H2 challenges.
- Exports: U.S. tariff extension (90 days) offers limited relief. Fading “rush exports” and higher tariffs vs peers will pressure shipments.
- Domestic market: Policies to boost consumption may lift confidence. Demand in silver economy, national tide, and green clothing could grow.
Enterprises must deepen digital/intelligent transformation, build modern industrial systems, and manage risks to ensure stable growth.
Relevant keywords: sexy lingerie OEM manufacturer, custom adult lingerie production, private label intimate apparel OEM, bulk erotic lingerie manufacturing, personalized sexy underwear OEM.